In today’s world, nothing is more powerful than data. From insightful analytics to eye-catching statistics, our society loves digging into the numbers. At Beatnik, we can help you set your own narrative with data, by creating real-time visual dashboards, eye-catching infographics and much more.
Enquire Now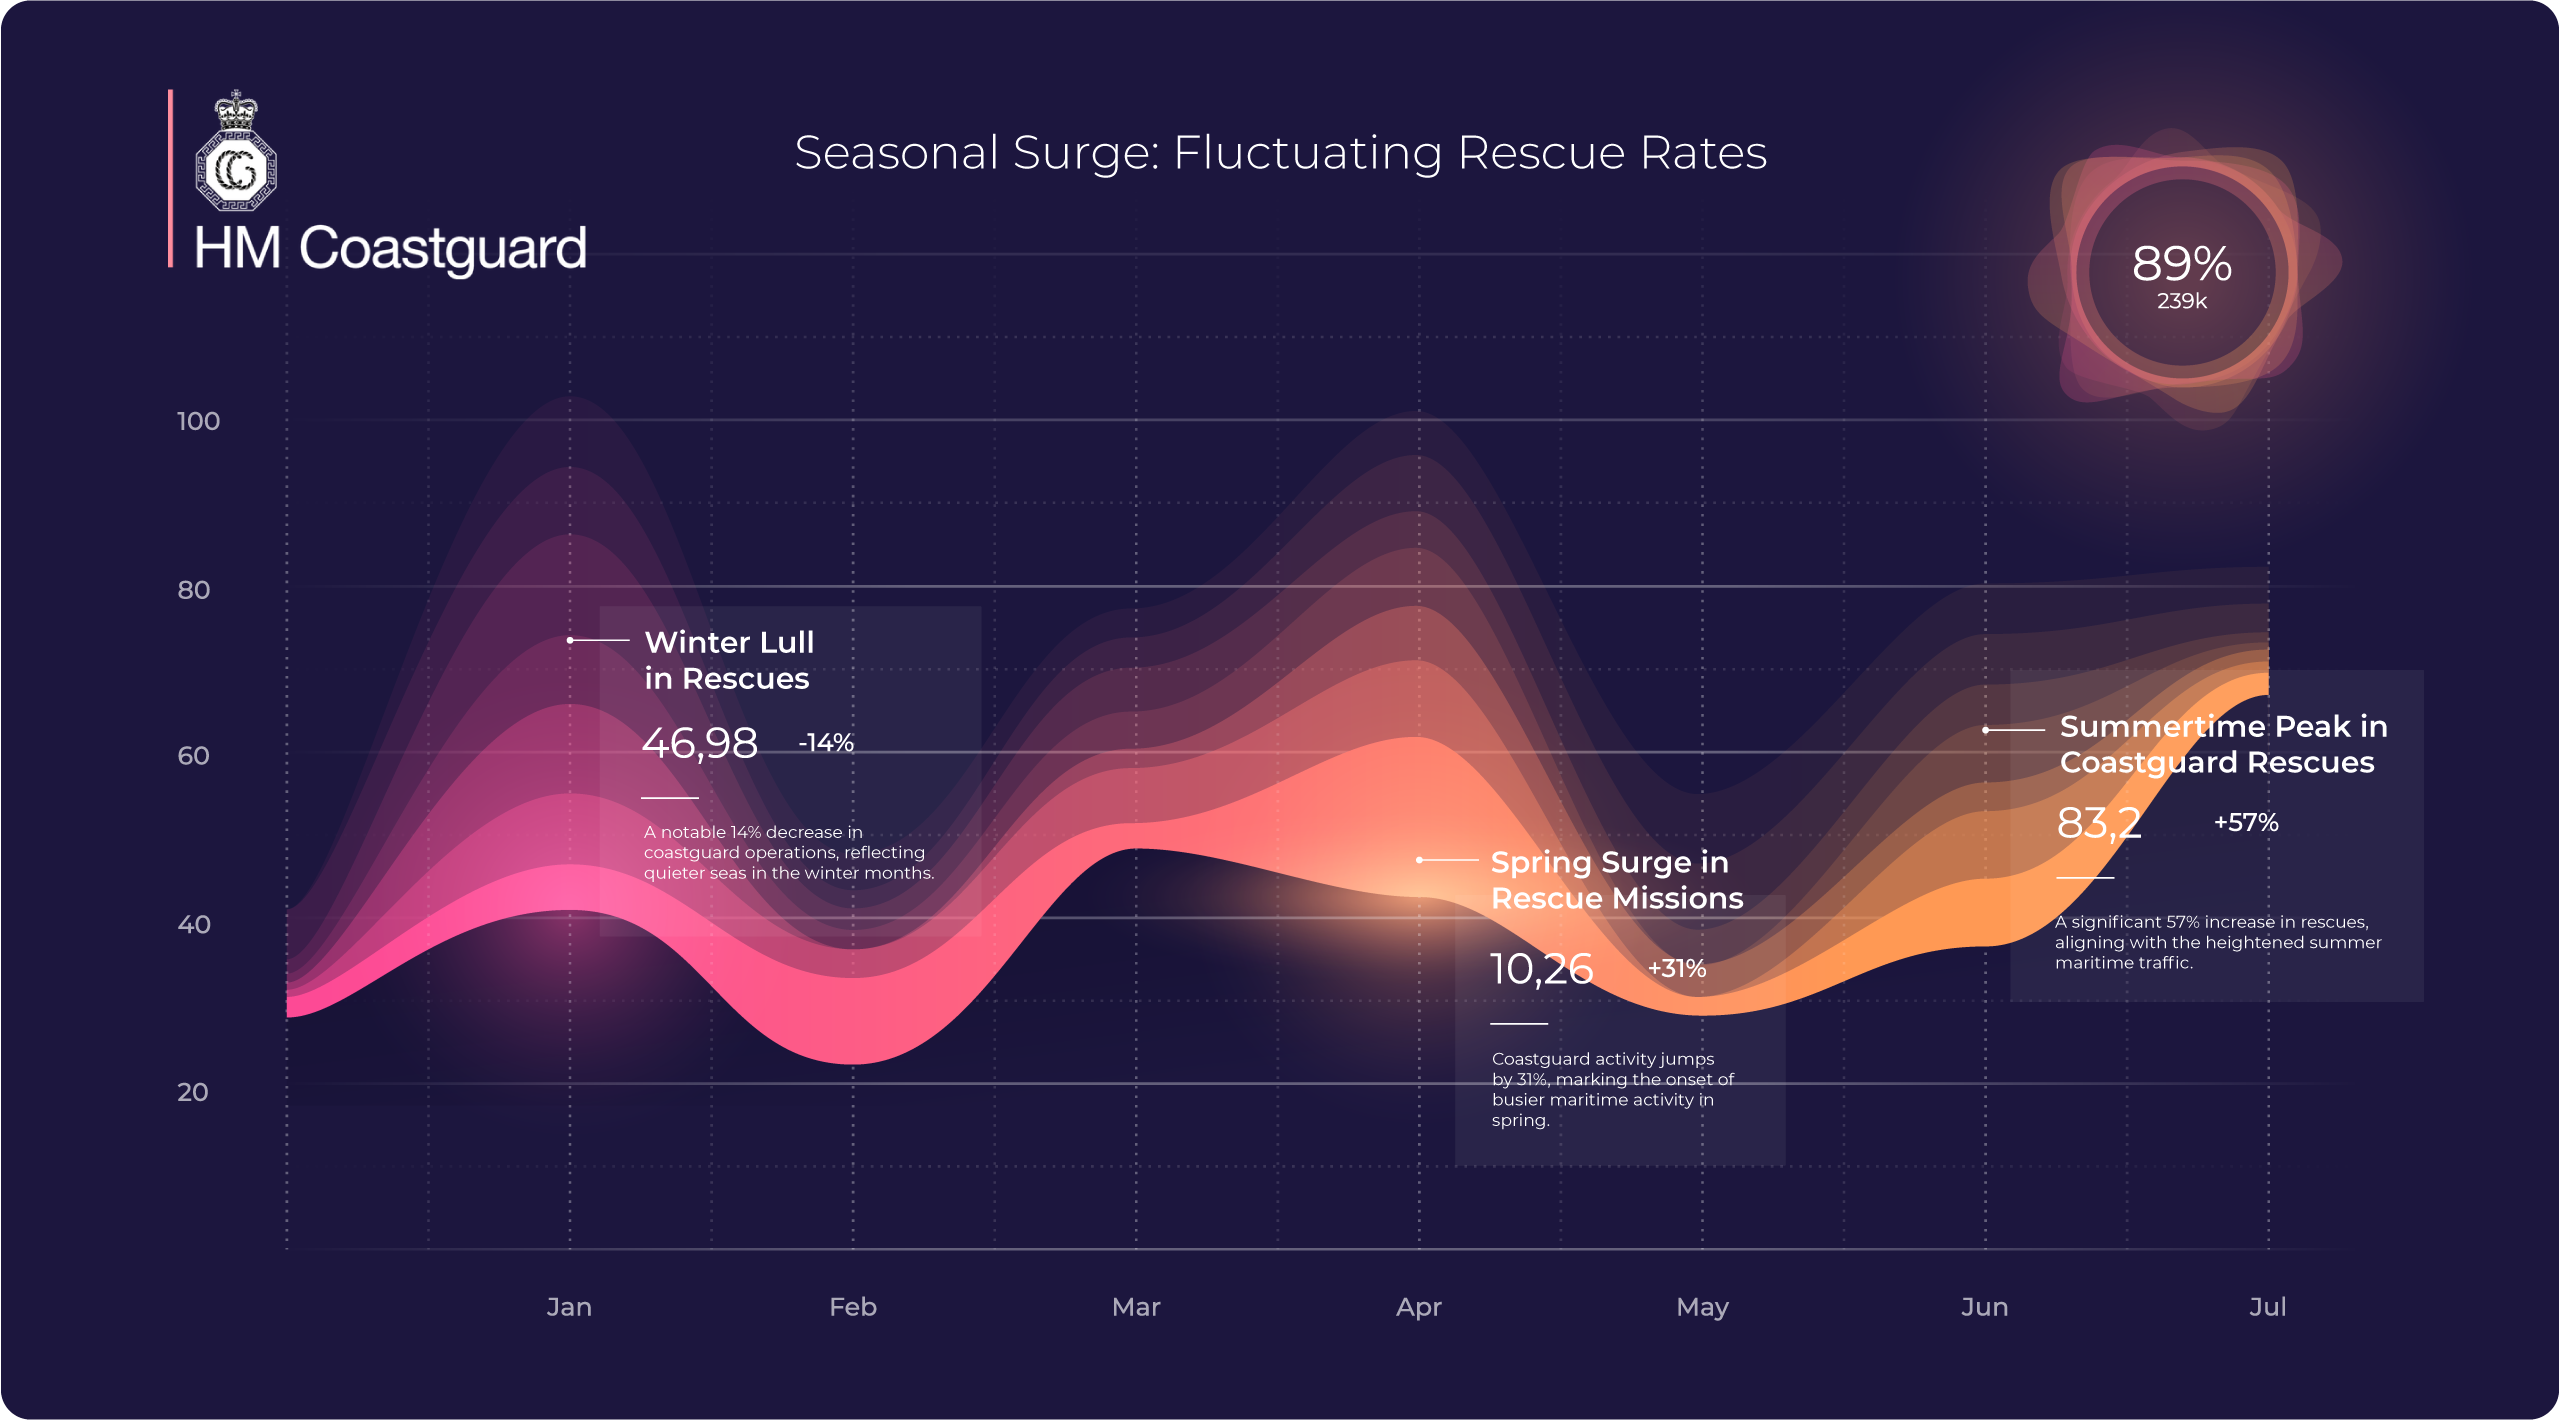
Unlike tools or software, working with real designers for data visualisation projects gives you more control over the input and output. You can tailor which data is used and enjoy full control over the end product, meaning you can tell any type of story in any type of format. Great ways to use data include:
Create full reporting dashboards that improve employee performance or give users real-time access to valuable data
Design engaging reports to educate, entertain or entice internal audiences or external customers
Promote your business with exciting infographics that translate data into visually engaging stories
With a unique background in editorial and media design, coupled with our specialisms in all things digital, Beatnik is well-positioned to make your data more engaging than ever before.
Data visualisation might sound confusing or misleading – it can be hard to…visualise. To make things clear, take a look at some exciting data visualisation projects we’ve worked on here at Beatnik.
Enquire Now
Engage your customers with better visuals
Data visualisation is just one way to tell a story. Design presents immense opportunities to redefine your business message through web design, apps and software. Contact Beatnik today, and we’ll weave a new story into your brand with whatever approach is best for the job.
Trusted by startups, councils and cultural organisations
